
在这个demo中将使用html5 canvas和jQuery来制作一个动态的饼状图表。
HTML
<div id="container">
<div class="wideBox">
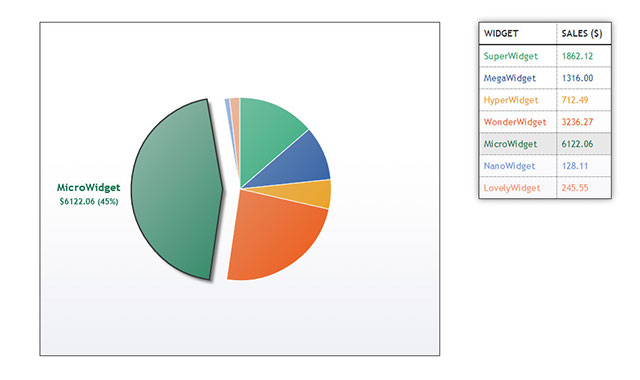
<h1>Widgets Sold in 2010</h1>
<p>Click a colour in the chart, or an item in the table, to pull out a slice! <a href="#">Back to Tutorial</a></p>
</div>
<canvas id="chart" width="600" height="500"></canvas>
<table id="chartData">
<tr>
<th>Widget</th><th>Sales ($)</th>
</tr>
<tr style="color: #0DA068">
<td>SuperWidget</td><td>1862.12</td>
</tr>
<tr style="color: #194E9C">
<td>MegaWidget</td><td>1316.00</td>
</tr>
<tr style="color: #ED9C13">
<td>HyperWidget</td><td>712.49</td>
</tr>
<tr style="color: #ED5713">
<td>WonderWidget</td><td>3236.27</td>
</tr>
<tr style="color: #057249">
<td>MicroWidget</td><td>6122.06</td>
</tr>
<tr style="color: #5F91DC">
<td>NanoWidget</td><td>128.11</td>
</tr>
<tr style="color: #F88E5D">
<td>LovelyWidget</td><td>245.55</td>
</tr>
</table>
</div>
HTML结构非常简单,它包括:
- 一个
container作为包裹容器。 - 一个用于绘制饼状图的HTML5 canvas。
- 一个表格用于放置图表数据。
配置图表函数、参数和可用变量
// Run the code when the DOM is ready
$( pieChart );
function pieChart() {
  // Config settings
  var chartSizePercent = 55;                        // The chart radius relative to the canvas width/height (in percent)
  var sliceBorderWidth = 1;                         // Width (in pixels) of the border around each slice
  var sliceBorderStyle = "#fff";                    // Colour of the border around each slice
  var sliceGradientColour = "#ddd";                 // Colour to use for one end of the chart gradient
  var maxPullOutDistance = 25;                      // How far, in pixels, to pull slices out when clicked
  var pullOutFrameStep = 4;                         // How many pixels to move a slice with each animation frame
  var pullOutFrameInterval = 40;                    // How long (in ms) between each animation frame
  var pullOutLabelPadding = 65;                     // Padding between pulled-out slice and its label
  var pullOutLabelFont = "bold 16px 'Trebuchet MS', Verdana, sans-serif";  // Pull-out slice label font
  var pullOutValueFont = "bold 12px 'Trebuchet MS', Verdana, sans-serif";  // Pull-out slice value font
  var pullOutValuePrefix = "$";                     // Pull-out slice value prefix
  var pullOutShadowColour = "rgba( 0, 0, 0, .5 )";  // Colour to use for the pull-out slice shadow
  var pullOutShadowOffsetX = 5;                     // X-offset (in pixels) of the pull-out slice shadow
  var pullOutShadowOffsetY = 5;                     // Y-offset (in pixels) of the pull-out slice shadow
  var pullOutShadowBlur = 5;                        // How much to blur the pull-out slice shadow
  var pullOutBorderWidth = 2;                       // Width (in pixels) of the pull-out slice border
  var pullOutBorderStyle = "#333";                  // Colour of the pull-out slice border
  var chartStartAngle = -.5 * Math.PI;              // Start the chart at 12 o'clock instead of 3 o'clock
  // Declare some variables for the chart
  var canvas;                       // The canvas element in the page
  var currentPullOutSlice = -1;     // The slice currently pulled out (-1 = no slice)
  var currentPullOutDistance = 0;   // How many pixels the pulled-out slice is currently pulled out in the animation
  var animationId = 0;              // Tracks the interval ID for the animation created by setInterval()
  var chartData = [];               // Chart data (labels, values, and angles)
  var chartColours = [];            // Chart colours (pulled from the HTML table)
  var totalValue = 0;               // Total of all the values in the chart
  var canvasWidth;                  // Width of the canvas, in pixels
  var canvasHeight;                 // Height of the canvas, in pixels
  var centreX;                      // X-coordinate of centre of the canvas/chart
  var centreY;                      // Y-coordinate of centre of the canvas/chart
  var chartRadius;                  // Radius of the pie chart, in pixels
  // Set things up and draw the chart
  init();
初始化图表
/**
   * Set up the chart data and colours, as well as the chart and table click handlers,
   * and draw the initial pie chart
   */

  function init() {

    // Get the canvas element in the page
    canvas = document.getElementById('chart');

    // Exit if the browser isn't canvas-capable
    if ( typeof canvas.getContext === 'undefined' ) return;

    // Initialise some properties of the canvas and chart
    canvasWidth = canvas.width;
    canvasHeight = canvas.height;
    centreX = canvasWidth / 2;
    centreY = canvasHeight / 2;
    chartRadius = Math.min( canvasWidth, canvasHeight ) / 2 * ( chartSizePercent / 100 );

    // Grab the data from the table,
    // and assign click handlers to the table data cells

    var currentRow = -1;
    var currentCell = 0;

    $('#chartData td').each( function() {
      currentCell++;
      if ( currentCell % 2 != 0 ) {
        currentRow++;
        chartData[currentRow] = [];
        chartData[currentRow]['label'] = $(this).text();
      } else {
       var value = parseFloat($(this).text());
       totalValue += value;
       value = value.toFixed(2);
       chartData[currentRow]['value'] = value;
      }

      // Store the slice index in this cell, and attach a click handler to it
      $(this).data( 'slice', currentRow );
      $(this).click( handleTableClick );

      // Extract and store the cell colour
      if ( rgb = $(this).css('color').match( /rgb\((\d+), (\d+), (\d+)/) ) {
        chartColours[currentRow] = [ rgb[1], rgb[2], rgb[3] ];
      } else if ( hex = $(this).css('color').match(/#([a-fA-F0-9]{2})([a-fA-F0-9]{2})([a-fA-F0-9]{2})/) ) {
        chartColours[currentRow] = [ parseInt(hex[1],16) ,parseInt(hex[2],16), parseInt(hex[3], 16) ];
      } else {
        alert( "Error: Colour could not be determined! Please specify table colours using the format '#xxxxxx'" );
        return;
      }

    } );

    // Now compute and store the start and end angles of each slice in the chart data

    var currentPos = 0; // The current position of the slice in the pie (from 0 to 1)

    for ( var slice in chartData ) {
      chartData[slice]['startAngle'] = 2 * Math.PI * currentPos;
      chartData[slice]['endAngle'] = 2 * Math.PI * ( currentPos + ( chartData[slice]['value'] / totalValue ) );
      currentPos += chartData[slice]['value'] / totalValue;
    }

    // All ready! Now draw the pie chart, and add the click handler to it
    drawChart();
    $('#chart').click ( handleChartClick );
  }
更多详细信息请查看:http://www.elated.com/articles/snazzy-animated-pie-chart-html5-jquery/
版权声明
文章来源: https://www.uihtm.com/jquery/8480.html
版权说明:仅限用于学习和研究目的;不得将上述内容用于商业或者非法用途,否则,一切后果请用户自负。我们非常重视版权问题,如有侵权请邮件(44784009#qq.com)与我们联系处理。敬请谅解!